
Prometheus, an open-source monitoring and alerting toolkit, is widely used for monitoring systems and applications in modern IT infrastructures. It collects metrics from configured targets at specified intervals, then evaluates rules to generate alerts. This blog post will walk you through the process of how to install and configure Prometheus on Rocky Linux, a popular Linux distribution.
Prerequisites
Before diving into the installation process, ensure that you have:
- A system running Rocky Linux
- A user with sudo privileges
- A stable internet connection
How to Install and Configure Prometheus on Rocky Linux
Update Your System
First, update your system packages to ensure you’re working with the latest versions. Open your terminal and run the following command:
sudo dnf update -yInstall Dependencies on Rocky Linux
Next, install the required dependencies for Prometheus:
sudo dnf install -y wget tarDownload and Install Prometheus on Rocky Linux
Download the latest Prometheus release from the official Prometheus website. At the time of writing, the latest release is 2.31.1. Use the following command to download the tarball:
wget https://github.com/prometheus/prometheus/releases/download/v2.31.1/prometheus-2.31.1.linux-amd64.tar.gz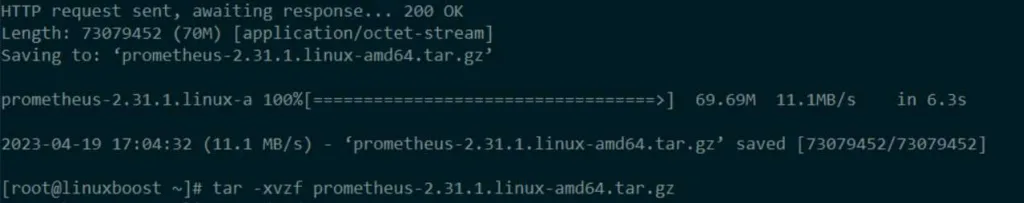
After downloading, extract the tarball:
tar -xvzf prometheus-2.31.1.linux-amd64.tar.gzMove the extracted files to the /usr/local/bin/ directory:
sudo mv prometheus-2.31.1.linux-amd64/prometheus /usr/local/bin/
sudo mv prometheus-2.31.1.linux-amd64/promtool /usr/local/bin/
Create the required directories and move the configuration files:
sudo mkdir /etc/prometheus
sudo mkdir /var/lib/prometheus
sudo mv prometheus-2.31.1.linux-amd64/prometheus.yml /etc/prometheus/
Create a Prometheus System User on Rocky Linux
To run Prometheus securely, create a dedicated system user:
sudo useradd -M -r -s /bin/false prometheusChange the ownership of the previously created directories:
sudo chown -R prometheus:prometheus /etc/prometheus /var/lib/prometheusCreate a Systemd Service File for Prometheus
To manage the Prometheus service, create a systemd service file:
sudo nano /etc/systemd/system/prometheus.servicePaste the following content into the file:
[Unit]
Description=Prometheus Monitoring System
Wants=network-online.target
After=network-online.target

[Service]
User=prometheus
Group=prometheus
Type=simple
ExecStart=/usr/local/bin/prometheus \
    --config.file /etc/prometheus/prometheus.yml \
    --storage.tsdb.path /var/lib/prometheus/ \
    --web.console.templates=/etc/prometheus/consoles \
    --web.console.libraries=/etc/prometheus/console_libraries

[Install]
WantedBy=multi-user.target
Save and exit the file.
Start and Enable Prometheus Service on Rocky Linux
Reload the systemd daemon and enable the Prometheus service:
sudo systemctl daemon-reload
sudo systemctl enable --now prometheus
Check the Prometheus service status:
sudo systemctl status prometheus
If everything is configured correctly, you should see the service running.
Configure Firewall
If you have a firewall enabled on your Rocky Linux system, you need to configure it to allow incoming connections to the Prometheus service. By default, Prometheus listens on port 9090.
- First, check if the firewall is active by running the following command:lua
sudo systemctl status firewalldIf the firewall is inactive, you can enable and start it using:
sudo systemctl enable firewalld
sudo systemctl start firewalld
Add a rule to allow incoming connections on port 9090:
sudo firewall-cmd --add-port=9090/tcp --permanent sudo firewall-cmd --reload This will open the required port in the firewall, making the Prometheus service accessible from external sources.
Verify Prometheus Installation on Rocky Linux
To verify that Prometheus is running correctly, open your web browser and navigate to http://your_server_ip:9090. You should see the Prometheus web interface, where you can run queries and view the status of the system.
Configure Prometheus with Alertmanager (Optional)
If you want to use Prometheus for alerting, you need to install and configure Alertmanager, a tool that handles alerts sent by Prometheus.
- Download the latest version of Alertmanager from the official GitHub repository:
wget https://github.com/prometheus/alertmanager/releases/download/vX.Y.Z/alertmanager-X.Y.Z.linux-amd64.tar.gzReplace X.Y.Z with the desired version number.
Extract the downloaded archive:
tar -xvf alertmanager-X.Y.Z.linux-amd64.tar.gzMove the extracted files to the /opt/alertmanager directory:
sudo mkdir /opt/alertmanager
sudo mv alertmanager-X.Y.Z.linux-amd64/* /opt/alertmanager/
Create a systemd service file for Alertmanager:
sudo nano /etc/systemd/system/alertmanager.serviceAdd the following content to the file:
[Unit]
Description=Alertmanager
Wants=network-online.target
After=network-online.target

[Service]
User=root
Group=root
Type=simple
ExecStart=/opt/alertmanager/alertmanager --config.file /opt/alertmanager/alertmanager.yml

[Install]
WantedBy=multi-user.target
Save the file and exit.
Reload the systemd configuration:
sudo systemctl daemon-reloadEnable and start the Alertmanager service:
sudo systemctl enable alertmanager
sudo systemctl start alertmanager
Update the Prometheus configuration to include Alertmanager:
sudo nano /etc/prometheus/prometheus.ymlAdd the following lines to the file:
alerting:
  alertmanagers:
  - static_configs:
    - targets:
      - 'localhost:9093'
Save the file and exit.
Restart the Prometheus service:
sudo systemctl restart prometheusConclusion
You have now successfully installed and configured Prometheus on your Rocky Linux system. With Prometheus up and running, you can start collecting and analyzing metrics from various systems and applications. You may also be interested in integrating Prometheus with other monitoring tools, such as Grafana or Zabbix and How to Install MongoDB on Rocky Linux